Creating a Tree Planting Prioritization Model in QGIS
This post was originally published on Azavea’s Summer of Maps blog.
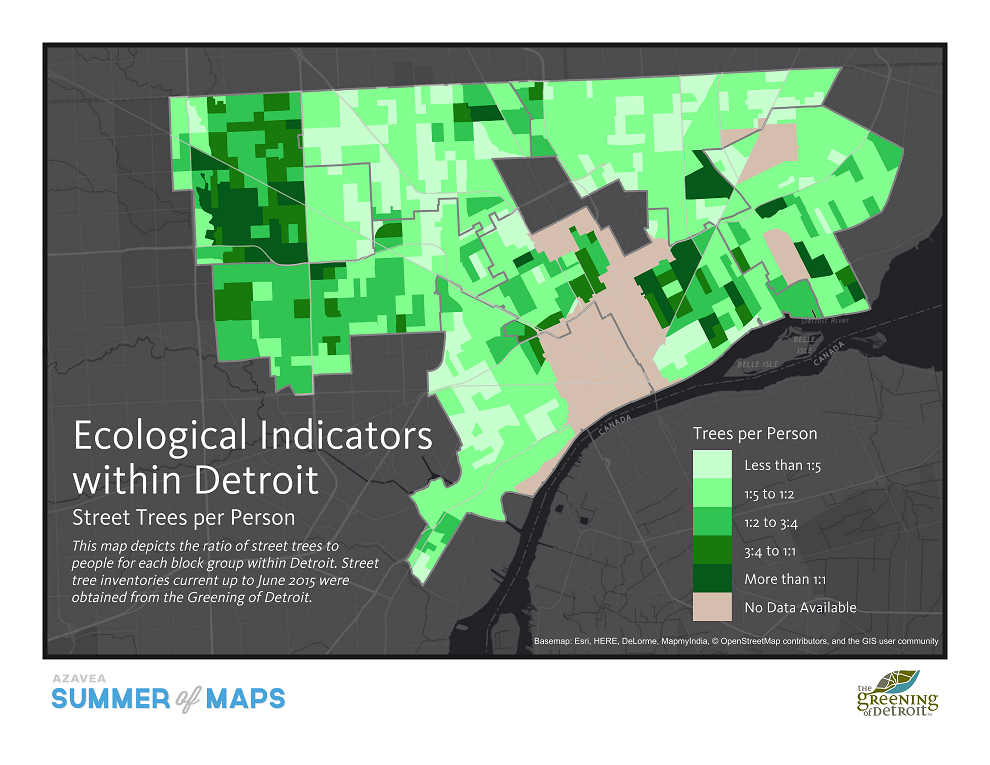
When the Greening of Detroit was founded in 1989, the organization consisted of only two people trying to stem the loss of trees to Dutch Elm Disease. Its responsibilities have grown enormously since then: it now acts as steward to most of Detroit’s 250,000 street trees, and is the largest planter of new street trees in the city. To make the most of its staff, trainees, and volunteers, The Greening of Detroit has to determine which planting sites within the city will provide the greatest long-term benefit to the city. To help them use their resources most effectively, I created a free, easy-to-use Geographic Information System (GIS) tool that determines which parts of Detroit have the highest need for street trees and the lowest street-tree coverage.
Detroit, like most American cities, could use more trees: after all, relative to their cost, street trees provide enormous long-term benefits to their surrounding environment. A single street tree can cool the neighborhood in summer, prevent sewer backups, and remove hundreds of tons of pollutants from the air throughout its lifetime. Trees can also change the social fabric of an area: high concentrations of street trees can lead to higher property values, healthier residents, and less crime. Many of these benefits are enjoyed primarily by the neighborhoods surrounding a given street tree, which means that tree planting groups have to decide not just how many trees to plant, but also what areas need trees the most.
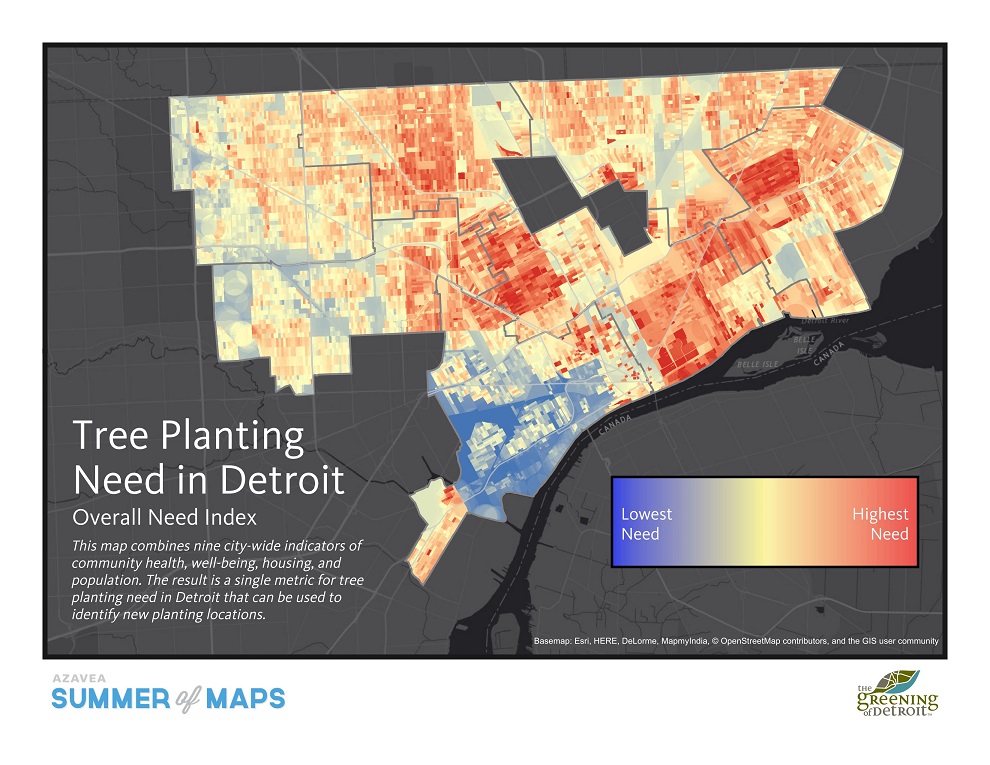
To determine which areas were best for new tree planting, I first created a map showing overall health, social, economic, and environmental need for new street trees in Detroit. With help from Greening, I determined nine factors that indicated a need for trees:
- Mortality due to asthma
- Mortality due to cardiovascular disease
- Rate of Low Birth Weight pregnancies
- Proportion of residents living below the poverty line
- Median housing values
- Crime rate
- Number of vacant homes
- Combined sewage overflow events
- Population density
I then assigned different weights to each of these factors based on their overall importance to Greening’s tree planting strategy, then combined them into a single indicator that represented overall need:
After representing overall need throughout the city, I used it to create a tree planting tool that Greening could run again and again to determine the highest-need areas over time. The planting tool was built using QGIS, a free and open-source GIS software. This tools uses four inputs:
- The overall tree need indicator, shown above
- The locations of all the street trees currently planted in Detroit, represented as points in space
- The locations and lengths of all roads in Detroit
- Areas that the Greening of Detroit wants to rank. These could be ZIP codes, city council districts, or any other meaningful areas in Detroit
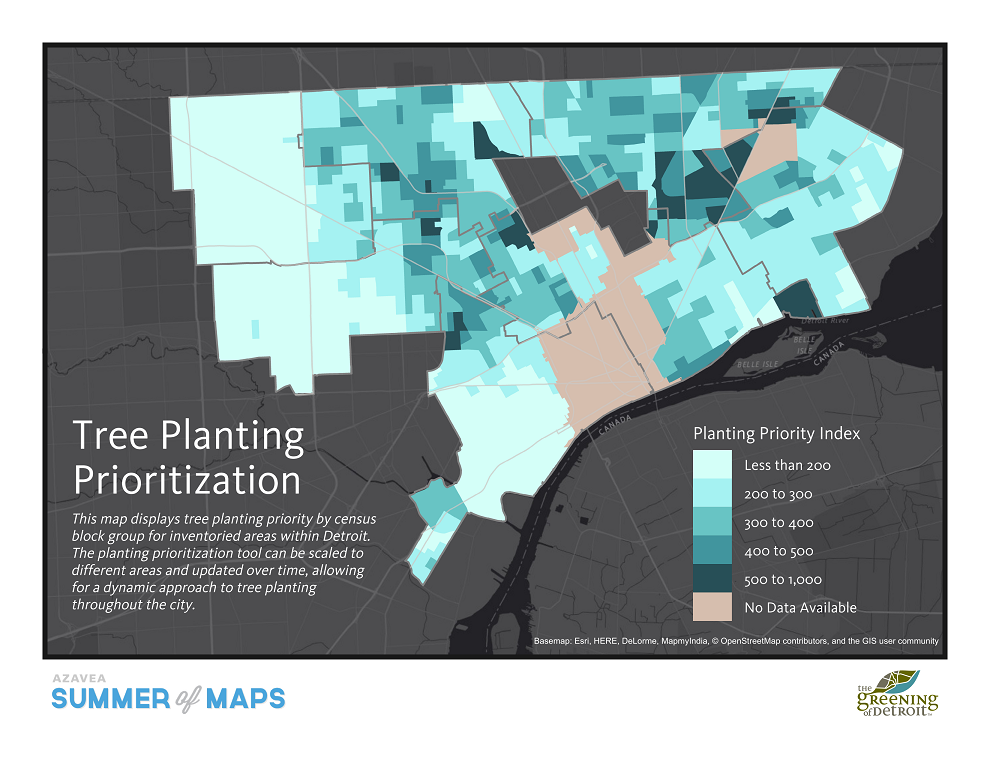
After loading all four of the inputs into QGIS, the user can simply run a tool that I created in the Graphical Modeler. The Graphical Modeler strings together a number of simple operations into more complicated processes. The model that I built finds the average density of street trees per mile of road within an area, and then divides the average need within the area by the average street tree density. This means that areas with higher need will be given higher priority, while areas with more existing trees will be given lower priority.
Using this model, the Greening of Detroit will be able to compare whatever areas they like, add street trees or change the road network over time, and experiment with different indicators of need. This makes the interactive model far more flexible than any static map, well-suited for a growing organization and a city in transition.
Want to know more? Please get in touch!


