
Mapping child mortality across low- and middle-income countries
Throughout 2019 and 2020, I served as the research lead on a project to map neonatal, infant, and child mortality across low- and middle- income countries (LMICs) worldwide.
Improving child survival and health worldwide is one of the most pressing issues of our time. In 2015, it was enshrined by the UN as Sustainable Development Goal 3.2:
By 2030, end preventable deaths of newborns and children under 5 years of age, with all countries aiming to reduce neonatal mortality to at least as low as 12 per 1000 live births and under-5 mortality to at least as low as 25 per 1000 live births.
Evidence from previous studies [1, 2] told a story of dramatic improvement: global child deaths fell by nearly half from 2000 to 2017, with the lion’s share of that reduction coming from LMICs. Our study focused on 99 LMICs where 93% of child deaths had occurred in 2017. By estimating local variation in child mortality from 2000-2017, we hoped to ask new questions about the successes and roadblocks to improving child health over that time, including:
- Did all regions within each country see improvements in child survival, or were certain areas being left behind?
- Would local estimation of mortality reveal any subnational trends or “hot spots” obscured by national analysis?
- Could we identify exemplary regions within countries that improved health more rapidly than their neighbors?
Given the scope of this analysis, our team undertook a massive data seeking and cleaning effort, ultimately including 555 household surveys and censuses that recorded 15.9 million births and 1.1 million deaths. Based on these data, we then constructed a geostatistical model that simultaneously estimated mortality across time, space (5 x 5 km pixel), and seven age groups ranging from birth to age 5. This novel space-time-age structure allowed us to produce estimates for multiple age groups of interest, including neonates (under 1 month of age), infants (under 1 year of age), and children under 5.
We aggregated and reported our pixel-level results across 17,554 districts in our study area. We collaborated with hundreds of public health experts working across LMICs to ensure that our data sources were reliable and as complete as possible, our analyses were appropriate, and we were presenting our results in a careful and responsible manner.
Read the paper (open access)
Under-5 mortality rate per 1000 live births, 2000-2017
Some of our key insights from this analysis include the following:
- We found substantial district-level variation in child mortality. In 2017, child mortality varied up to 10-fold by district within a single country, and nearly 40-fold across all districts in the study area.
- While the vast majority of districts in the study area saw some improvement in child survival from 2000 to 2017, we found variation in how equitably these improvements were distributed across districts in each country. Rwanda was an exemplar for equitable improvements in survival: in 2017, the worst-performing Rwandan district still had an under-5 mortality rate 61% lower than the best-performing Rwandan district in 2000.
- At the national level, Colombia, Guatemala, Libya, Panama, Peru, and Vietnam all had achieved the SDG 3.2 target of at least as low as 25 child deaths per 1,000 live births in 2017, but had districts, municipalities or provinces that did not achieve the goal.
- A growing proportion of child deaths are occurring in “low”-mortality areas. In 2000, only 1.2% of deaths occurred in study areas achieving the SDG 3.2 target. By 2017, this percentage had grown over six-fold, to 7.3%.
In 2019, our study was published in Nature alongside a commentary from Michelle Bachelet, the UN High Commissioner on Human Rights.
I worked with the visualization team at the Institute for Health Metrics and Evaluation to create an interactive web map showing our results in more detail, as well as a scrollyteller highlighting our key findings. Both visualizations were released alongside the published study.
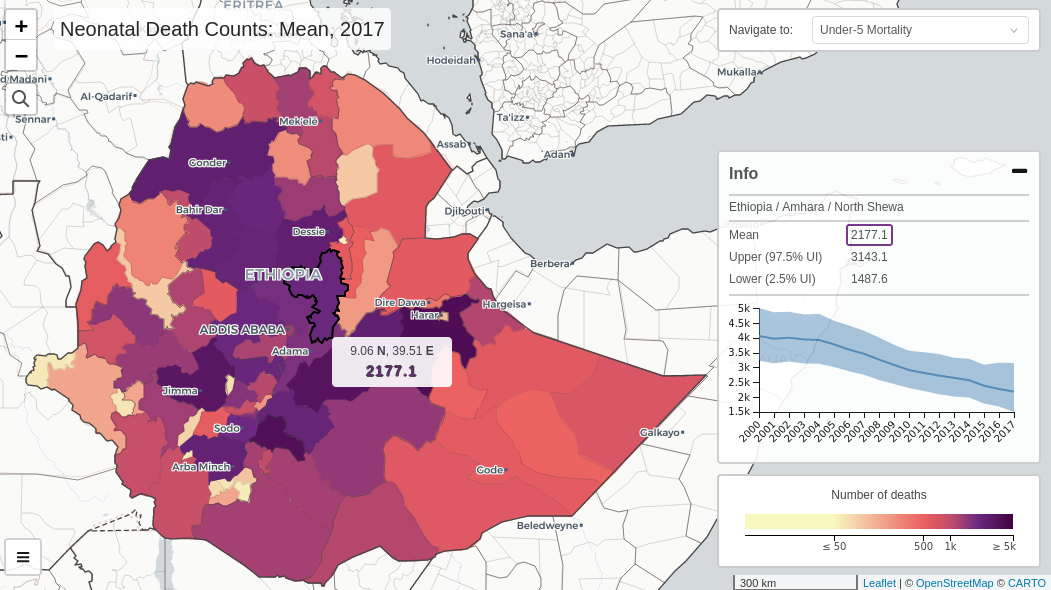
Interactive web map showing neonatal deaths across Ethiopia in 2017
Screenshot from the scrollyteller accompanying our publication
Media and policy engagement
Our study’s findings initially attracted attention from policymakers, the media, and global health funders:
- The Bill & Melinda Gates Foundation incorporated our data into their 2019 Goalkeepers Report, which explored subnational inequality in child mortality across Chad, India, and Nigeria. Bill Gates ultimately presented subnational child mortality maps using our data on the floor of the 2019 UN General Assembly.
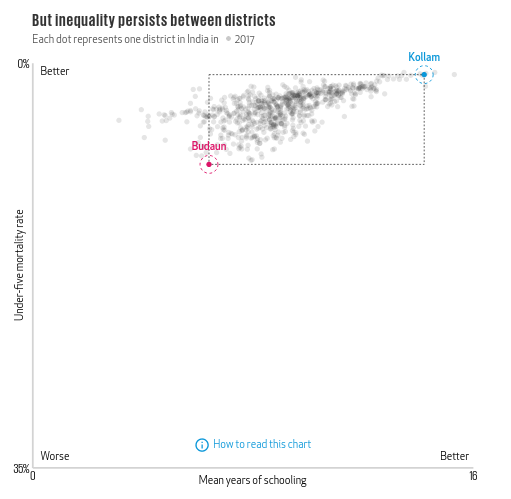
Chart incorporating our data from the 2019 Goalkeepers Report
- I shared our team’s findings with data journalists at The Upshot, which they covered in an article that was ultimately featured on page A1 of the New York Times print edition.
- After publication, the findings from our study were featured in outlets such as The Telegraph, AFP, El Pais, Sinc, The Deccan Herald, and El Mundo. It was also the subject of an op-ed by Nafsiah Mboi, the former Minister of Health of Indonesia, in the Jakarta Post.
Since publication, the findings from our study have been used to inform several child mortality reduction initiatives:
- I provided custom aggregations of our under-5 mortality estimates to the Surveillance Unit of the World Health Organization Global Malaria Programme. These estimates have been used to prioritize health districts for a High-Burden High-Impact training initiative.
- Our estimates are being used by the “MORDOR” study to target high-burden districts for a pilot Azithromycin Mass Drug Administration initiative to reduce childhood mortality.
- I worked closely with the Public Health Foundation of India to closely investigate our district-level child mortality estimates, resulting in a report on infant and under-5 mortality across India that will be used to assist health system planning.
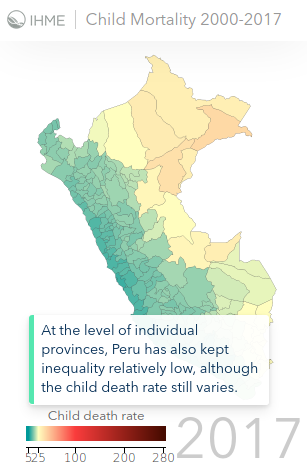
- I created custom maps of child mortality within Bangladesh, Ethiopia, Nepal, Peru, Rwanda, and Senegal—these maps were used to inform analysis and included in the final reports for the [Exemplars in Under-5 Mortality] study.
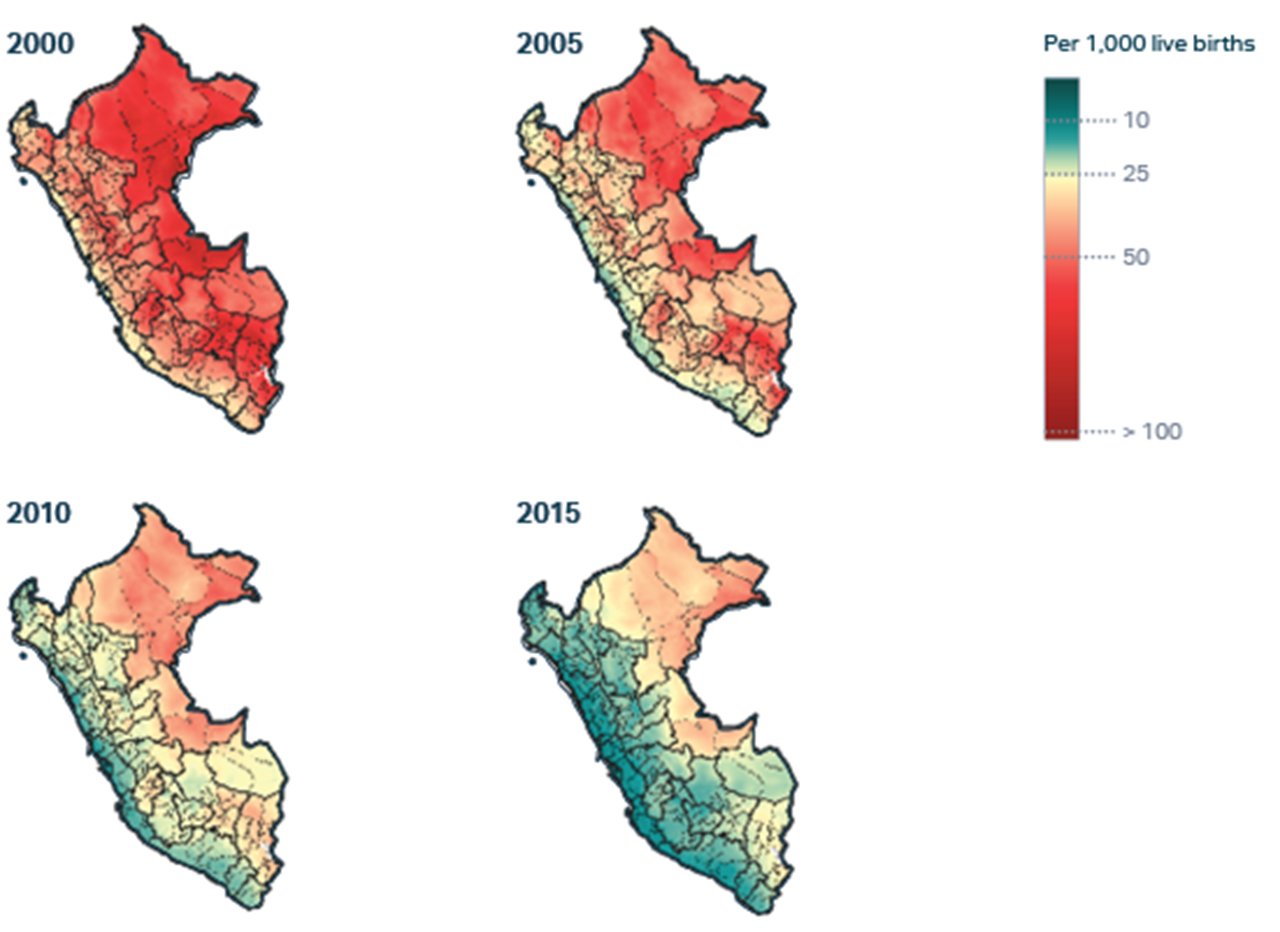
Maps of child mortality across Peru, featured on the Exemplars in Global Health website
Want to know more? Please get in touch!