Visualizing Poverty, Disability, and Legal Need in Philadelphia
As part of Azavea’s Summer Fellowship, I conducted a spatial analysis project with the Legal Clinic for the Disabled (LCD), a pro bono legal services organization for low-income individuals with disabilities that operates throughout southeastern Pennsylvania. The Legal Clinic approached me with three core goals:
- Better understand the need for LCD’s services across Philadelphia
- Characterize the extent of LCD’s services over time and space
- Demonstrate the value that LCD provided to its clients, particularly through its Medical-Legal Partnerships with local hospitals
I used spatial analysis and geographic visualization to transform client records and publicly-available data into tools that LCD can use to tell its story and better serve its clients.
Interactive Web Map
After organizing client intake data provided by the Legal Clinic for the Disabled, it became apparent that the intakes could be better understood by organizing them on the basis of referral sources, disability types, and legal need types. I created an interactive web map and infographic to organize information gleaned from the anonymized intake data and compare it against public metrics on poverty and disability.
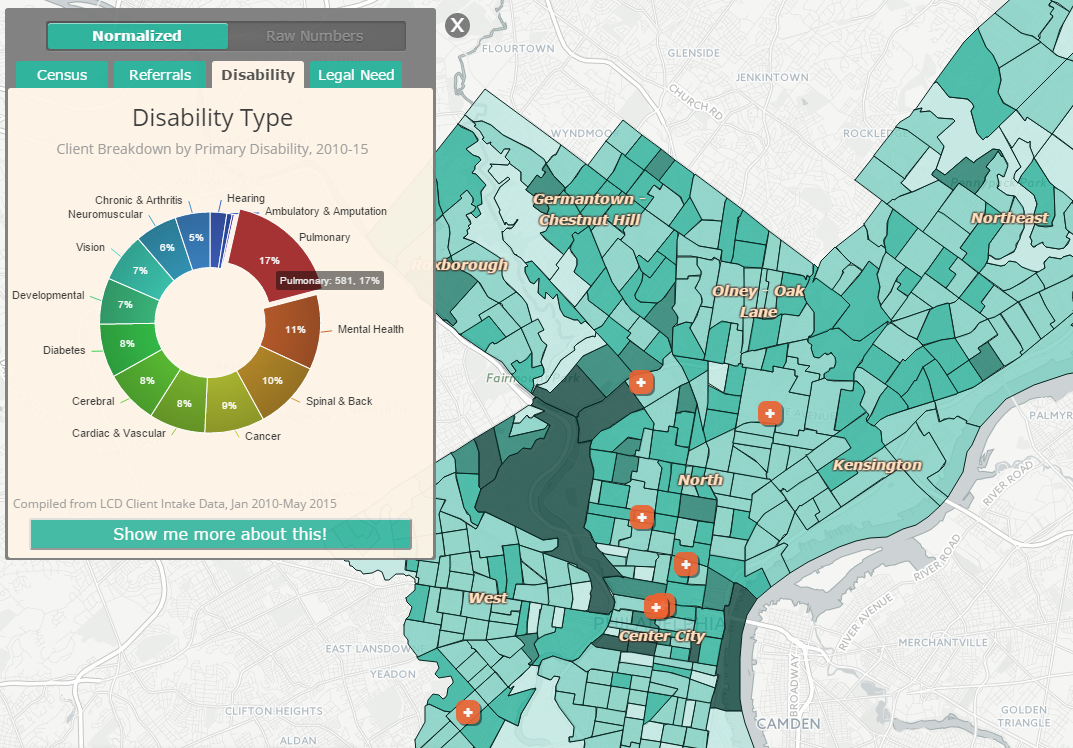
This map is designed to be easily navigable by potential LCD members, clients, and medical partners. When the “Census” tab is selected, the user can select one of four buttons, each representing a different census population estimate by census tract. When the “Referrals,” “Disability,” or “Legal Need” tabs are highlighted, the default map will show total LCD intakes by census tract from 2010 to 2015.
Each of the latter three tabs contains a pie chart showing the breakdown of client intakes based on that tab’s theme:
The user can hover their mouse over different segments of the pie chart to show counts for that particular category. If the user wishes to view only intakes from that subcategory, they can click on the subcategory, then press the “Show me more about this!” button at the bottom. The map will change to only display intakes from that sub-category. To view all intakes once again, the user can change their tab, or else press the “Reset View” button below the pie chart.
Want to know more? Please get in touch!
