Is Seattle a 15-minute city? It depends on where you want to walk
This could be a pivotal year for mobility in Seattle. In the final week of January, Seattle won $25.7 million in federal grants to build safer streets, made transit free for 10,000 Seattle Housing Authority residents, and solicited public feedback on a major update to the city’s Comprehensive Plan. To transform this momentum into meaningful change, we need a catalyst—a coherent, powerful vision for moving around Seattle.
Consider the 15-minute city: first imagined by Carlos Moreno and most fully realized (so far) in Paris, this model describes a metropolis where residents can satisfy the full spectrum of their daily needs within a 15-minute walk or bike ride.
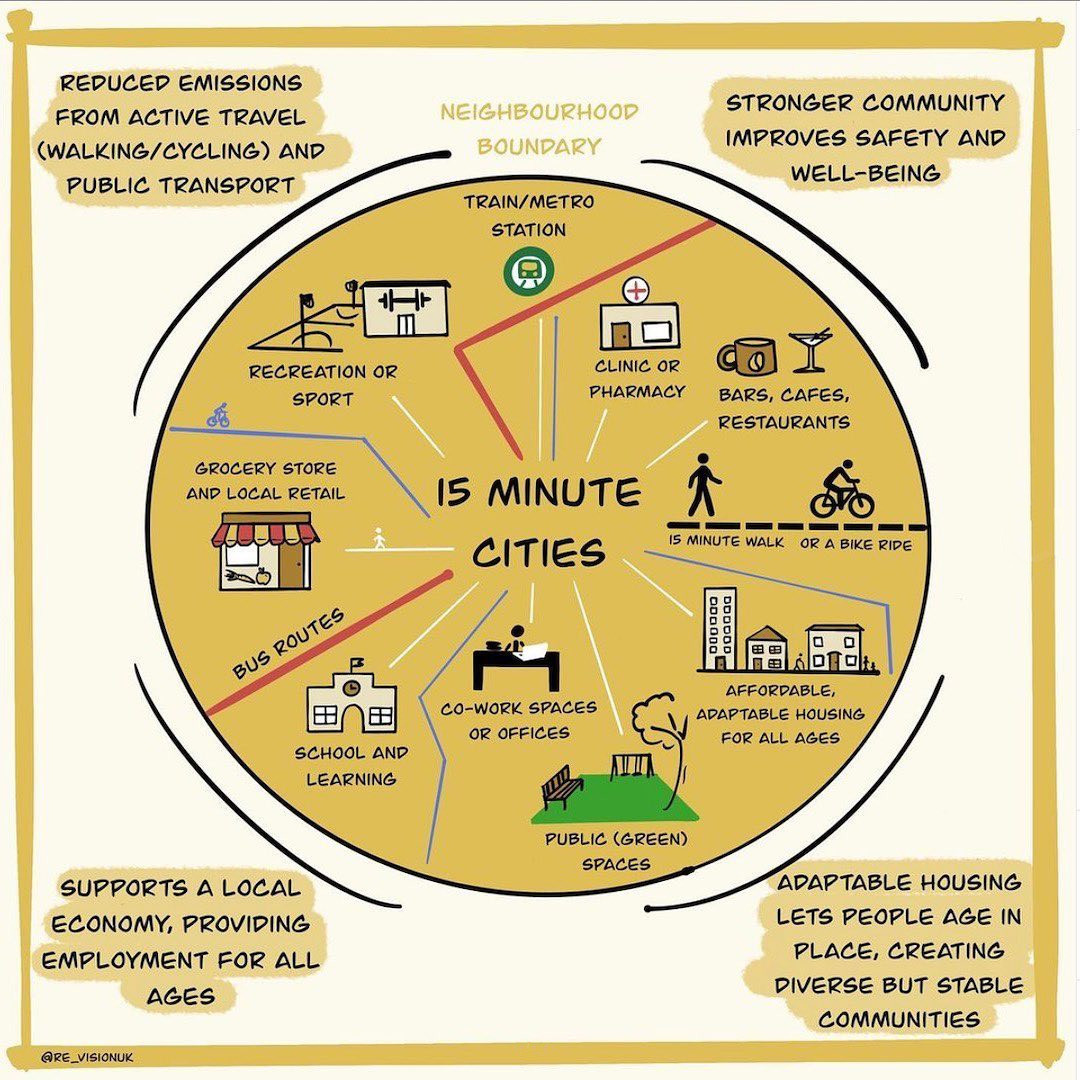 Concept diagram of the 15-minute city. Source: @re_visionuk
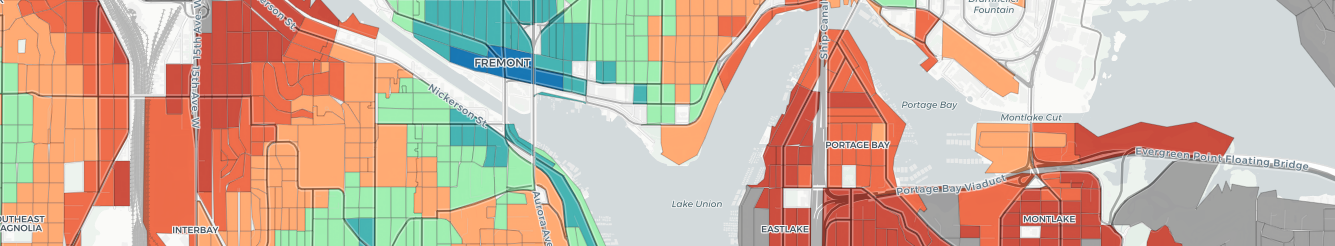
The 15-minute city could be a compelling target for the future of mobility in Seattle, and some of our elected officials have expressed interest in the possibility. To better understand how Seattle might become a 15-minute city, I created an interactive map showing walking times to amenities across the city. These include:
- Supermarkets
- Public libraries
- Parks that are 20,000 square feet or larger (excluding "pocket parks")
- Bus stops connecting directly to downtown Seattle
- Light rail stations
- Restaurants and coffee shops
- Public schools, split by grade level
Select amenities from the check boxes below to automatically update the map. The color shown for each block represents the maximum walking time across all selected amenities. You can pan and zoom on the map; hover over a block or tap on mobile to see specific travel times.
By combining travel time data with the population of each block, we can count how many Seattleites are less than a 15-minute walk from each class of amenity:
| Service | Access (citywide) |
|---|---|
| Parks | >99% |
| Bus stops connecting to downtown | 97% |
| Restaurants | 91% |
| Coffee shops | 90% |
| Groceries | 73% |
| Elementary schools | 62% |
| Libraries | 49% |
| Link stops | 27% |
| Middle schools | 18% |
| High schools | 15% |
Credit where credit is due: it’s great that over 99% of residents have walking access to a public park, and 97% have walking access to a direct bus downtown. On a less impressive note, it will surprise no one that light rail stations are not walkable for most Seattle residents. Middle and high schools are walkable for less than 20% of Seattleites due to their size and placement in less-dense neighborhoods.
To check how closely neighborhoods of Seattle match the 15-minute city model, we can count how many residents have full walking access to combinations of amenities:
- Standard: 15-minute walking access to a supermarket, a public library, a public park, a bus stop to downtown, a restaurant, and a coffee shop
- Standard + Link: Access to all of the “standard” amenities plus a light rail stop
- Standard + Elementary School: Access to all of the “standard” amenities plus an elementary school. Possibly suitable for a family with young children.
- Standard + High School: Access to all of the “standard” amenities plus a high school. Possibly suitable for a family with teenaged children.
| Neighborhood | Pop. | Standard | S + Link | S + Elem. | S + High |
|---|---|---|---|---|---|
| Citywide | 737,000 | 44% | 21% | 27% | 9% |
| Downtown (CBD) | 5,300 | >99% | >99% | 0% | 0% |
| International District | 4,500 | >99% | 97% | >99% | 0% |
| Pioneer Square | 4,400 | >99% | >99% | 35% | 0% |
| Pike Place Market | 3,300 | 97% | 97% | 0% | 0% |
| Ballard: Adams | 15,800 | 97% | 0% | 63% | 37% |
| Capitol Hill: Broadway | 28,100 | 94% | 91% | 82% | 0% |
| South Lake Union | 12,400 | 92% | 42% | 5% | 0% |
| Madrona | 4,100 | 91% | 0% | 91% | 15% |
| Green Lake | 10,300 | 84% | 44% | 83% | 31% |
| Central District: Atlantic | 8,700 | 83% | 2% | 83% | 48% |
| First Hill | 13,600 | 81% | 81% | 15% | 0% |
| Beacon Hill: New Holly | 4,900 | 81% | 66% | 81% | 0% |
| Belltown | 24,300 | 78% | 78% | 0% | 0% |
| University District | 34,400 | 78% | 77% | 2% | 14% |
| Queen Anne: West | 7,500 | 77% | 0% | 70% | 0% |
| Wallingford | 18,500 | 76% | 9% | 21% | 49% |
| Beacon Hill: North | 12,800 | 76% | 71% | 76% | 11% |
| Fremont | 14,800 | 73% | 0% | 71% | 31% |
| Lake City: Cedar Park | 6,500 | 71% | 0% | 0% | 2% |
| Central District: Mann | 5,200 | 71% | 0% | 65% | 53% |
| Yesler Terrace | 5,400 | 67% | 67% | 67% | 0% |
| Roosevelt | 9,000 | 61% | 44% | 40% | 42% |
| W. Seattle: N. Admiral | 13,600 | 61% | 0% | 54% | 44% |
| Columbia City | 15,100 | 60% | 54% | 34% | 2% |
| Rainier Valley: Dunlap | 6,400 | 58% | 42% | 58% | 58% |
| Delridge: Roxhill | 4,300 | 56% | 0% | 39% | 40% |
| Greenwood | 18,200 | 56% | 0% | 50% | 0% |
| Northeast: Bryant | 5,600 | 53% | 0% | 53% | 0% |
| Leschi | 5,800 | 52% | 0% | 52% | 36% |
| W. Seattle: Fairmount Park | 7,700 | 45% | 0% | 45% | 0% |
| Central District: Minor | 11,400 | 44% | 0% | 38% | 44% |
| Bitter Lake | 10,200 | 42% | 0% | 41% | 7% |
| Queen Anne: East | 9,800 | 39% | 0% | 31% | 0% |
| Pinehurst | 8,400 | 39% | 13% | 15% | 0% |
| Lake City: Victory Hts. | 5,900 | 38% | 0% | 13% | 12% |
| Magnolia: Southeast | 5,500 | 37% | 0% | 37% | 0% |
| Maple Leaf | 11,500 | 36% | 31% | 25% | 0% |
| Ballard: West Woodland | 8,100 | 36% | 0% | 25% | 26% |
| Ravenna | 12,800 | 36% | 2% | 31% | 3% |
| Magnolia: Briarcliff | 5,900 | 33% | 0% | 33% | 0% |
| Lake City: Olympic Hills | 9,500 | 32% | 0% | 28% | 0% |
| Rainier Beach | 6,900 | 31% | 11% | 31% | 18% |
| Queen Anne: North | 12,200 | 29% | 0% | 11% | 0% |
| Phinney Ridge | 10,400 | 27% | 0% | 22% | 0% |
| SoDo/Industrial District | 1,100 | 25% | 25% | 12% | 0% |
| Wedgwood | 9,300 | 24% | 0% | 24% | 0% |
| Magnolia: Lawton Park | 9,800 | 21% | 0% | 20% | 0% |
| Beacon Hill: South | 5,400 | 21% | 19% | 21% | 0% |
| Rainier Valley: Brighton | 8,900 | 20% | 20% | 20% | 0% |
| Uptown | 14,200 | 20% | 0% | 16% | 0% |
| View Ridge | 5,700 | 19% | 0% | 19% | 0% |
| Delridge: Highland Park | 6,700 | 18% | 0% | 18% | 0% |
| Mount Baker | 8,300 | 18% | 8% | 18% | 7% |
| Beacon Hill: Mid-Beacon Hill | 13,800 | 17% | 12% | 15% | 0% |
| W. Seattle: Gatewood | 6,900 | 17% | 0% | 17% | 0% |
| Broadview | 8,600 | 16% | 0% | 16% | 0% |
| Stevens | 12,100 | 15% | 14% | 15% | 0% |
| Delridge: High Point | 8,300 | 15% | 0% | 15% | 0% |
| Lake City: Meadowbrook | 3,500 | 14% | 0% | 0% | 6% |
| W. Seattle: Seaview | 5,000 | 13% | 0% | 11% | 0% |
| Whittier Heights | 5,700 | 13% | 0% | 13% | 0% |
| Loyal Heights | 8,700 | 13% | 0% | 13% | 13% |
| Harrison/Denny-Blaine | 2,700 | 11% | 0% | 10% | 0% |
| Delridge: South | 6,600 | 10% | 0% | 9% | 5% |
| W. Seattle: Fauntleroy | 5,700 | 9% | 0% | 7% | 0% |
| Seward Park | 7,100 | 3% | 0% | 1% | 0% |
| Sunset Hill | 6,000 | 2% | 0% | 2% | 0% |
| W. Seattle: Arbor Heights | 5,400 | 2% | 0% | 2% | 0% |
| Matthews Beach | 6,600 | 2% | 0% | 0% | 2% |
| South Park | 3,700 | 1% | 0% | 1% | 0% |
| Northgate: Haller Lake | 8,800 | 1% | 0% | 0% | 1% |
| Northgate: N. College Park | 7,500 | 0% | 0% | 0% | 0% |
| North Beach/Blue Ridge | 5,700 | 0% | 0% | 0% | 0% |
| Crown Hill | 5,200 | 0% | 0% | 0% | 0% |
| Sand Point | 700 | 0% | 0% | 0% | 0% |
| Windermere | 4,900 | 0% | 0% | 0% | 0% |
| Laurelhurst | 4,900 | 0% | 0% | 0% | 0% |
| Interbay | 2,300 | 0% | 0% | 0% | 0% |
| Portage Bay | 1,500 | 0% | 0% | 0% | 0% |
| Eastlake | 5,200 | 0% | 0% | 0% | 0% |
| Montlake | 4,700 | 0% | 0% | 0% | 0% |
| Madison Park | 4,600 | 0% | 0% | 0% | 0% |
| Westlake | 4,000 | 0% | 0% | 0% | 0% |
| W. Seattle: Alki | 7,200 | 0% | 0% | 0% | 0% |
| W. Seattle: Genesee | 9,100 | 0% | 0% | 0% | 0% |
| Delridge: North | 4,900 | 0% | 0% | 0% | 0% |
| Delridge: Riverview | 4,200 | 0% | 0% | 0% | 0% |
| Georgetown | 1,400 | 0% | 0% | 0% | 0% |
| Rainier View | 4,000 | 0% | 0% | 0% | 0% |
Despite Seattle’s high rankings on conventional walking metrics, only 44% of Seattleites can walk to basic city amenities. Seattle as a whole would need major changes to fulfill the vision of a 15-minute city. Of the 89 neighborhoods considered, only nine are “15-minute neighborhoods” walkable for 90% or more of their residents. On the other end of the spectrum, 27 neighborhoods—including large portions of West Seattle, Delridge, and Northeast Seattle—are extremely unwalkable, with less than 10% of their residents able to walk to basic amenities.
Seattle has a range of walkable neighborhoods with elementary schools, stretching from North Admiral in West Seattle to Bryant in the northeast. Parents of teenagers have far fewer options: only the Mann and Dunlap neighborhoods offer most of their residents walking access both to nearby high schools (Garfield High and Rainier Beach High, respectively) as well as to basic city amenities.
In some neighborhoods, including Loyal Heights, Mid-Beacon Hill, and South Park, walkability is one well-placed library or grocery store away. However, in most areas with very low walkability, building more accessible neighborhoods may require fundamental shifts to the distribution of housing and services across the city. We might be able to chart a way forward by focusing on walkability at the block level. Blocks with 15-minute walking access to basic amenities extend far beyond the boundaries of the “Urban Villages” targeted in Seattle’s previous Comprehensive Plans. These pockets of walkability could be the starting point for targeting more inclusive growth across the city.
For those who think that a 15-minute city is still a worthy vision for Seattle, I hope this map is a useful tool to turn momentum into action.
Postscript: Technical details
Population by block came from the 2020 US Census. Shapefiles for city blocks and bodies of water came from the US Census TIGER/Line shapefiles. Blocks listed as having zero population in the 2020 Census were not displayed on the interactive map.
I pulled destination locations from a few sources:
- Supermarkets: Pulled prospective supermarket locations from OpenStreetMap (OSM) using the Overpass API, filtered using the “supermarket” and “convenience” tags. I then reviewed the prospective locations using Google Maps, dropping closed locations, convenience stores, mini markets, and specialty stores. My heuristics for including a store as a supermarket were (a) two or more display rows dedicated to fresh produce and (b) two or more aisles dedicated to household goods such as cleaning supplies or toiletries. I manually added the Costco on 4th Ave S, which OpenStreetMaps had listed as a wholesale store. A limitation of this analysis is that high-end grocery stores may not be affordable to many of the people who live within walking distance.
- Public libraries: Downloaded from the King County Open GIS Portal
- Parks: Downloaded from the City of Seattle Open GIS Portal and subset to parks with an area greater than 20,000 square feet
- Bus stops and light rail: Downloaded from the King County Open GIS Portal. Light rail stops were filtered using the route number. To determine the transit routes that passed through Downtown Seattle, I used the transit schedules from the King County Metro website.
- Restaurants: Pulled from OSM, filtered using the “restaurant” tag
- Coffee shops: Pulled from OSM, filtered using the “coffee” and “cafe” tags
- Schools: Downloaded from the King County Open GIS Portal and subset to public schools in Seattle. K-8 schools are coded as both elementary and middle schools. For some alternative public schools with multiple locations, I hand-coded all locations listed on their website. Edit 8 Feb 2023: Thanks to Twitter users who pointed out that this dataset was missing Lincoln High School! I have manually added it to the list of high schools and re-created the map and tables.
For all destinations except for public libraries, parks, and schools, I used a geographic filter that extended beyond Seattle’s borders to account for destinations slightly outside the city. Data was pulled throughout 2022 so may be a few months out of date at the time of writing.
I calculated all walking times from blocks to amenities using OpenRouteService, which relies on street network data from OpenStreetMap. Origin points were the centroid of each block. The routing tool uses a walking speed of 5 kilometers per hour, or about 3 miles per hour. I found all origin-destination combinations that were less than 2.5 km apart as the crow flies, then calculated actual walking time for each candidate pair using a locally-hosted instance of the OpenRouteService Matrix API. For each block, the final travel time to an amenity is the shortest travel time to any destination in that amenity category.
Caveats
Walking times to Seattle Public Schools reflect the closest school by travel time, even when a household falls within the attendance area for a different school. For a map of all Seattle Public Schools attendance areas, see these maps. All public parks in Seattle above 20,000 square feet were included in this analysis, including green spaces that may not be designed for recreation.
For the final table of results, I used the neighborhood boundaries published by the Office of the Seattle City Clerk. If you take issue with the neighborhood boundaries, I defer to the Office of the Clerk and their disclaimer :)
Have questions or comments? Let me know!